Our Results
Plumcroft Primary School is a GOOD school. To read our latest OFSTED report please click here.
Click Here to view our school performance table.
Early Years Foundation Stage 2022 Results:
Communication and language combined 79% (Listening and attention 79%, Speaking 79%)
Personal, Social and emotional combined 87% (Self-regulation 84%, Managing Self 88%, Building relationships 89.7%)
Physical combined 89.9% (Gross motor 95%, Fine motor 84.8%)
Literacy combined 72.5% (Comprehension 77.7%, Word reading 72%, writing 68%)
Maths combined 70% (Number 71%, Numerical patterns 69%)
Knowledge and understanding combined 76.9% (Past and present 75%, People, cultures & communities 76%, The natural world 79.7%)
Creative combined 85.5% (Creating with materials 86%, Being expressive and imaginative 85%)
Good level of development overall 60%
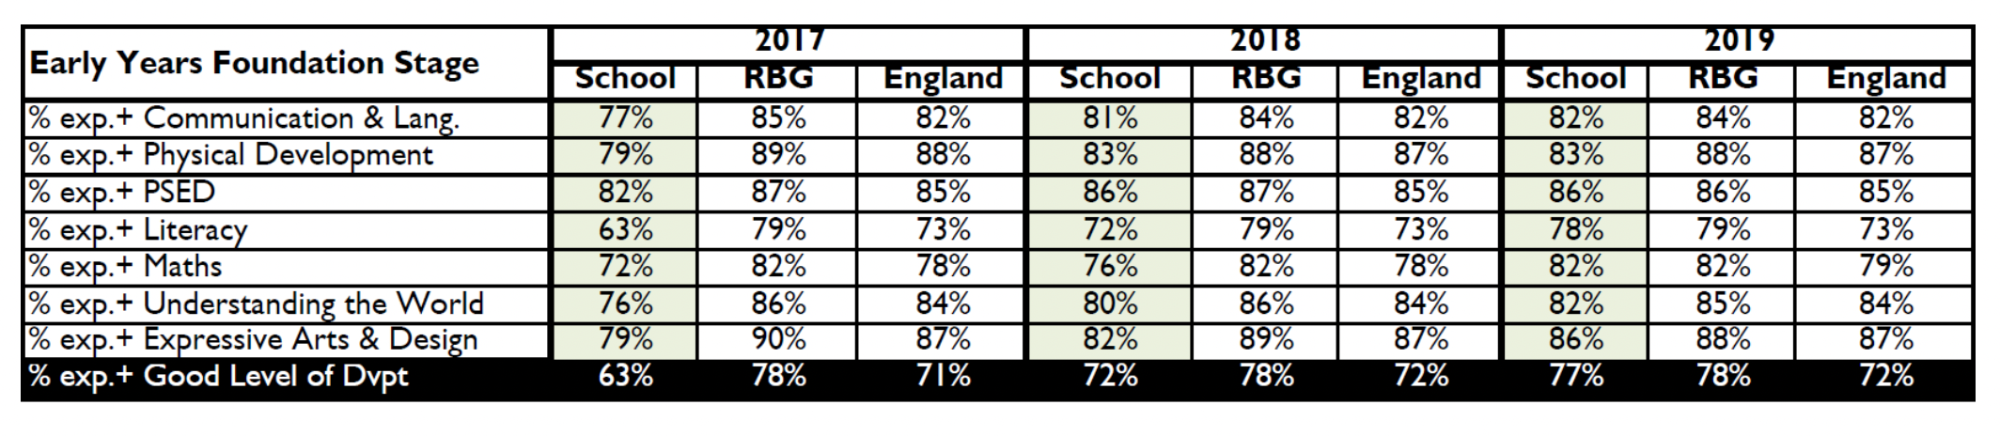
Historical EYFS Results:
Phonics Results 2022:
- Year 1 Phonics Screening: We have 81% of Year 1 pupils working at the expected level.
- Year 2 Phonics retakes: We have 88% of all Year 2 pupils working at the expected level.
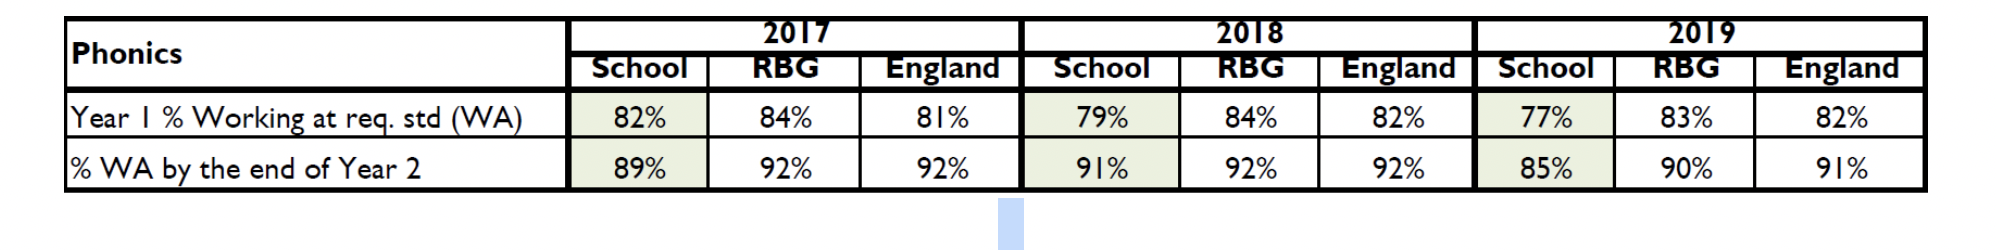
Historical Phonics Results:
Key Stage 1 Results 2022:
Reading (At or above Expected): 74.8% (including all new children). 77.4% (excluding four pupils working on the Engagement model in Orchard or Acorn). Working at greater depth: 23.4%
Writing (At or above Expected): 70.6% (including all new children). 71.6% (excluding four pupils working on the Engagement model in Orchard or Acorn). Working at greater depth: 12%
Maths (At or above Expected): 80.2% (including all new children). 82.5% (excluding four pupils working on the Engagement model in Orchard or Acorn). Working at greater depth: 25.5%
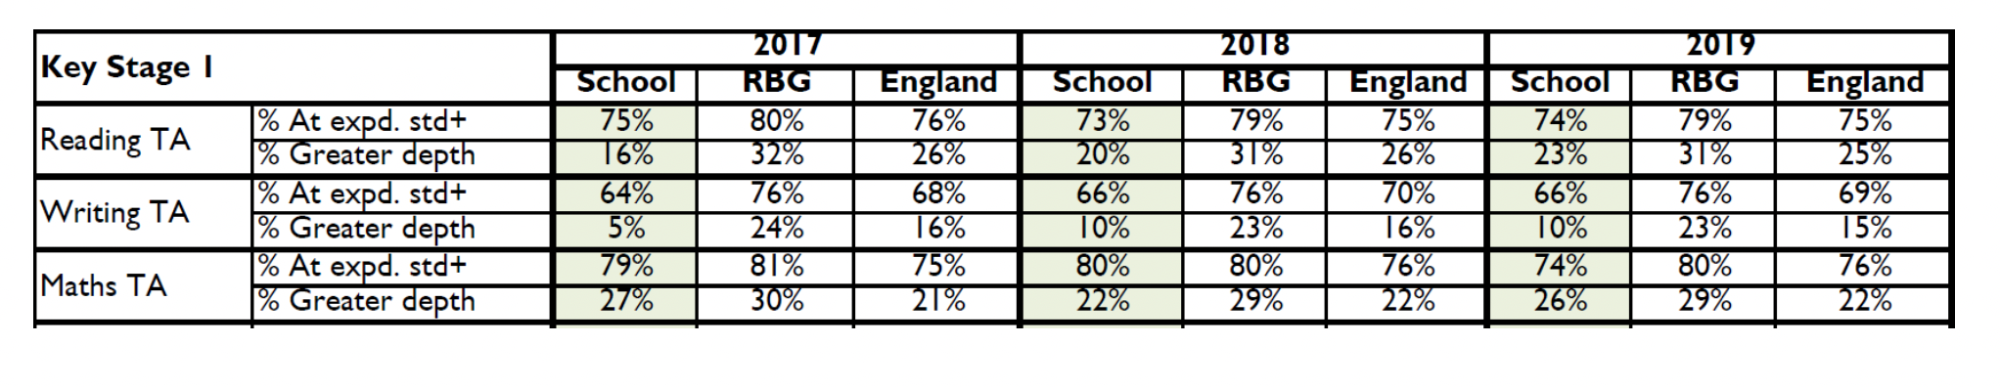
Historical KS1 Results:
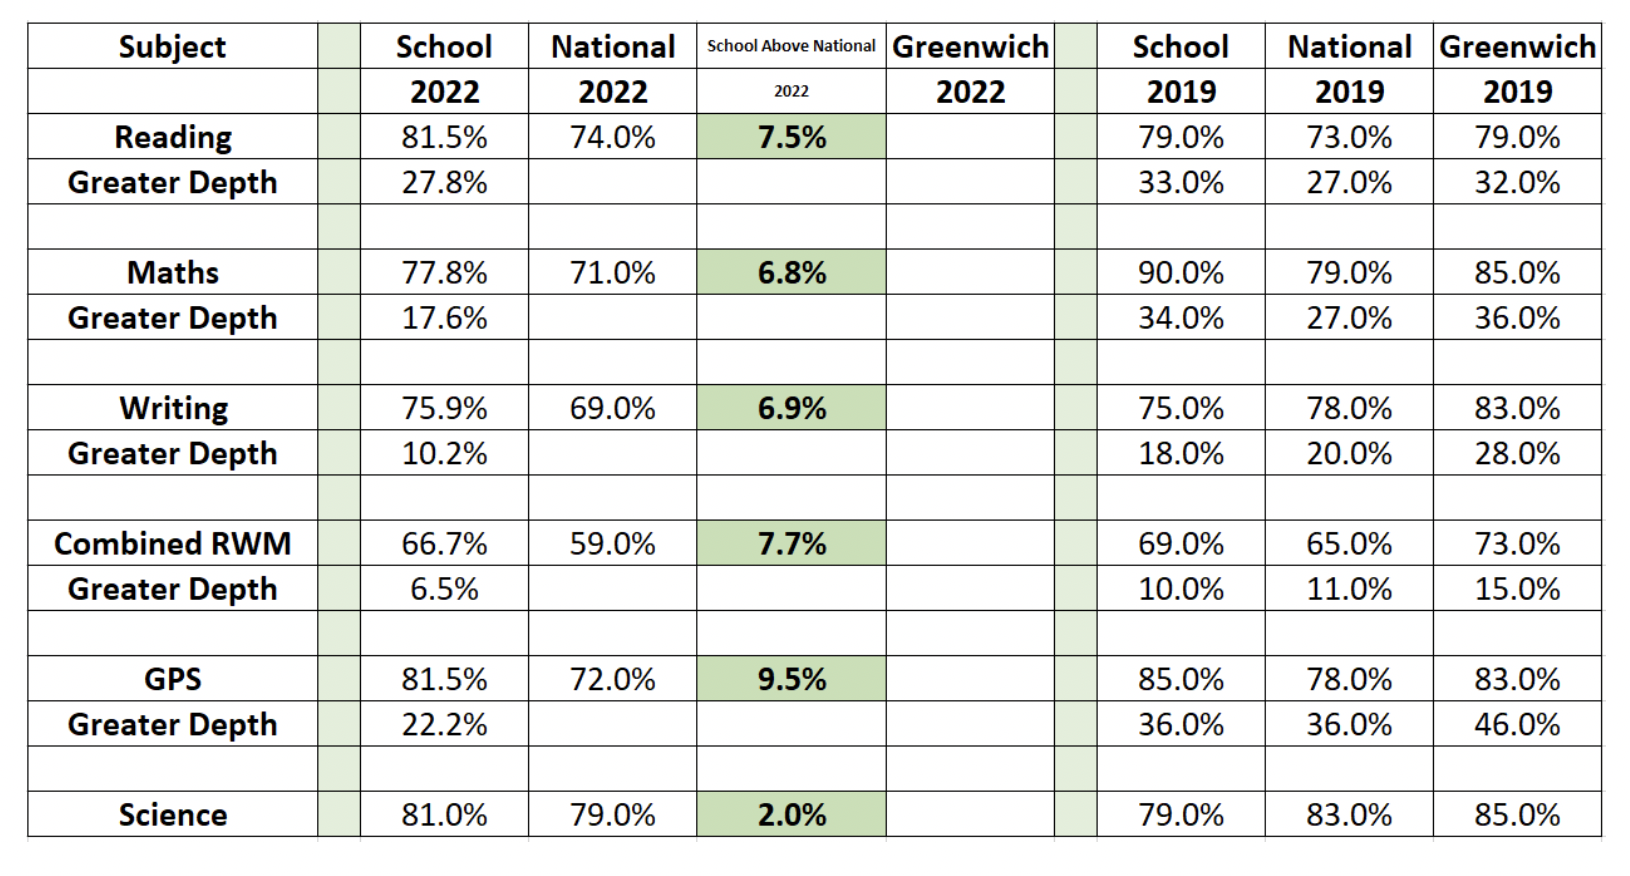
Key Stage 2 Results 2022: